
ES:
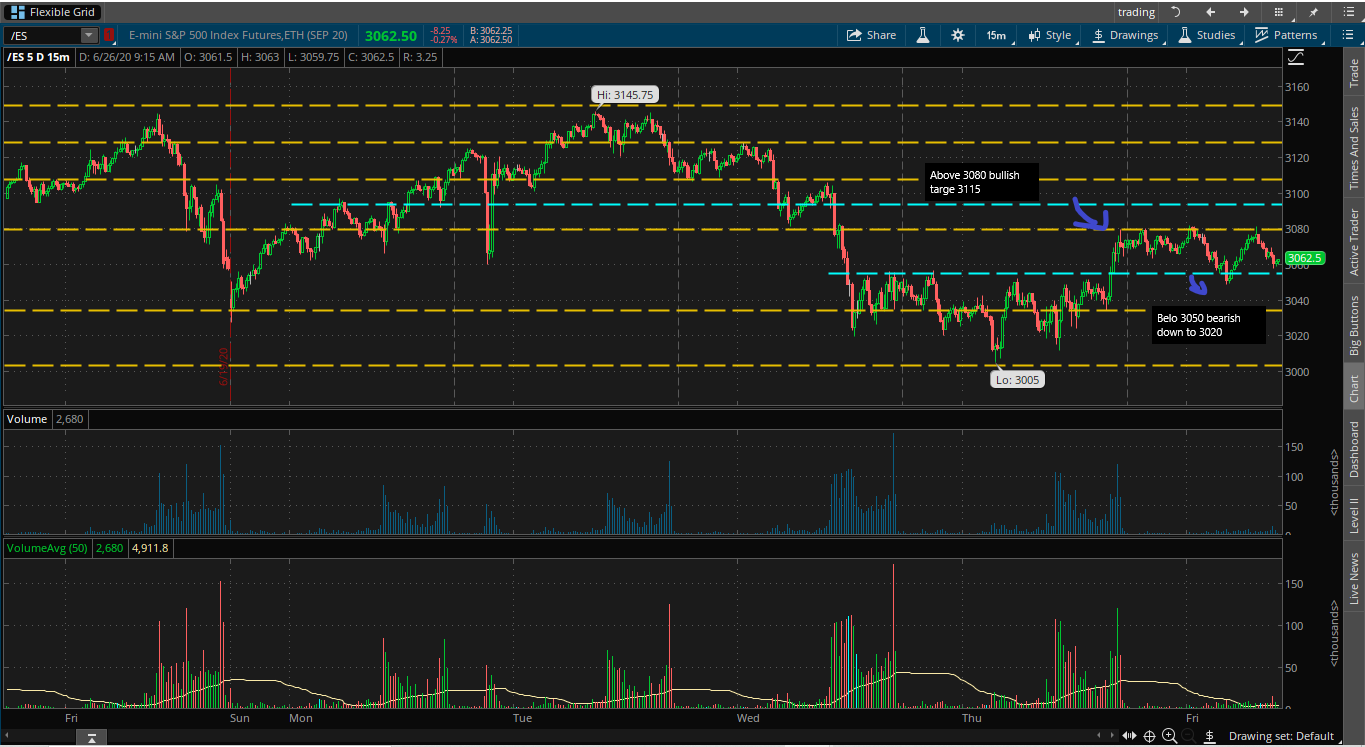
Market is a little range bound but we saw a strong move up yesterday. We could see continuation or a sell off like typical on Fridays. The levels will indicate which one.
AMZN:
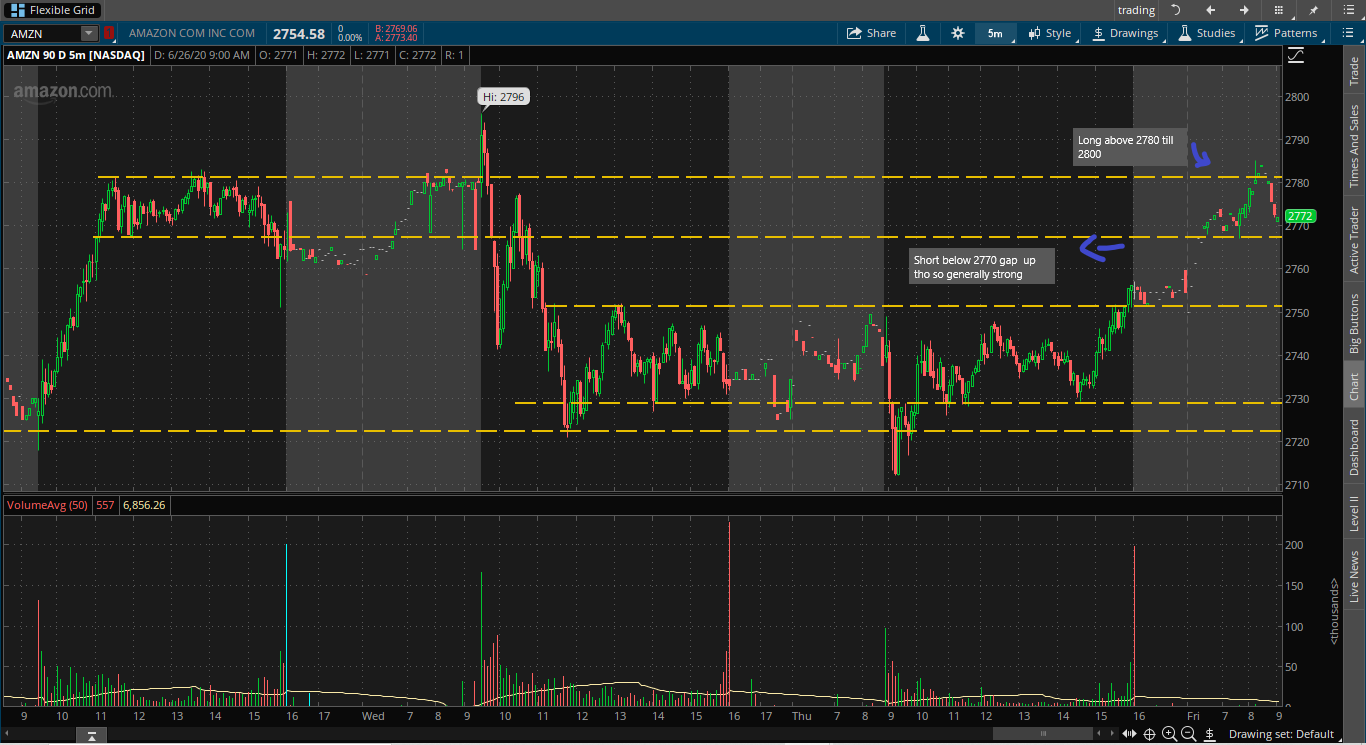
AMZN gapping up and holding resistance. If the resistance holds then short below support if not following the major trend of the stock long as resistance breaks.
TSLA:
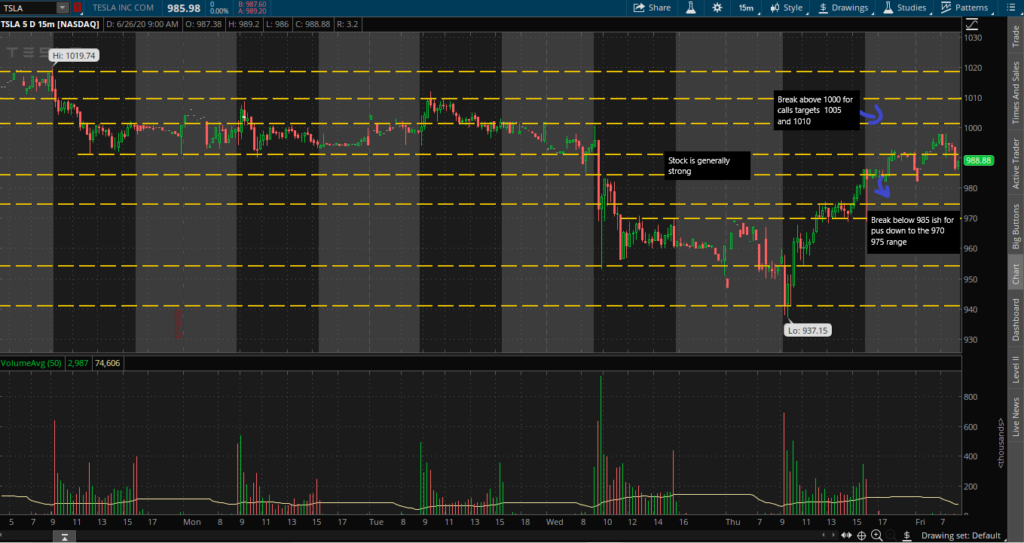
TSLA dumped hard this week and has made a recovery. Looking to long above major resistance and the inflection point one thousand. If not catch the momo down as it all through its last support point.
NVDA:
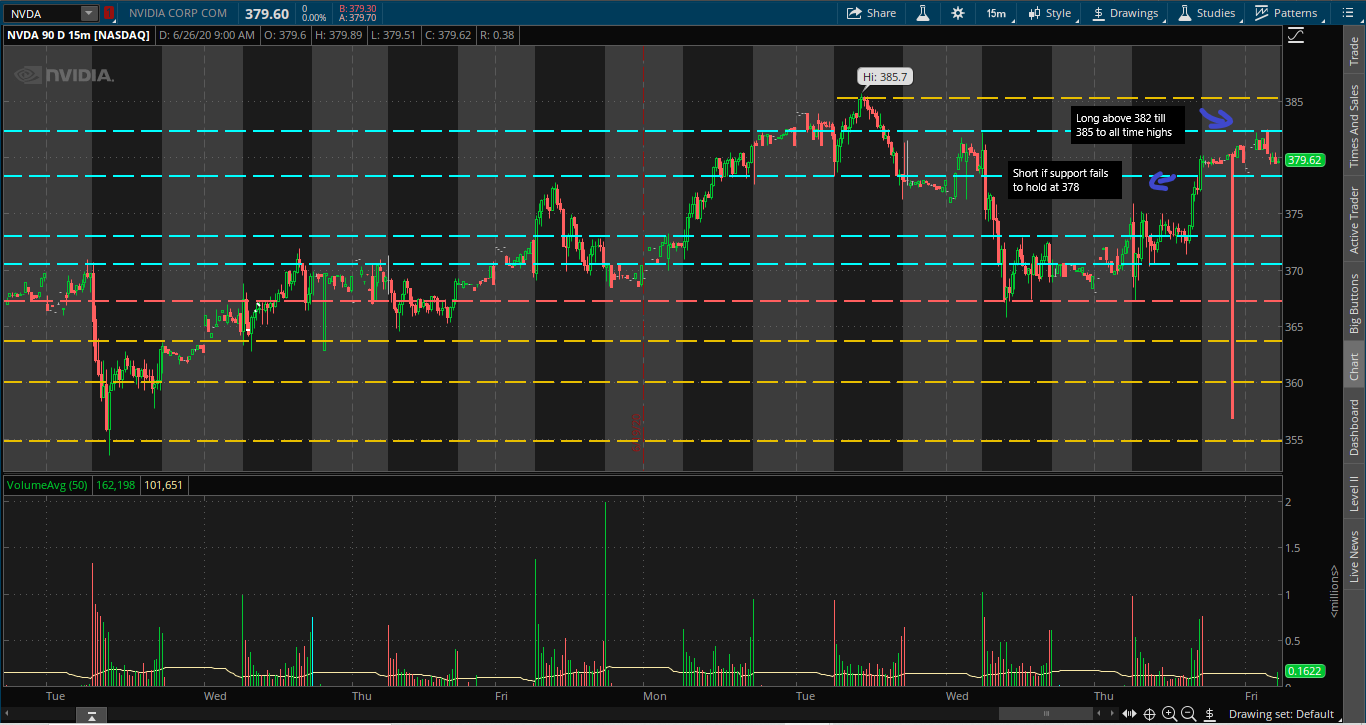
NVDA pushing into possible new all time highs with resistance at 382. Going long here will allow for a strong play into the highs possible re entering for new all time highs. This can be scalped short below the support at 378.
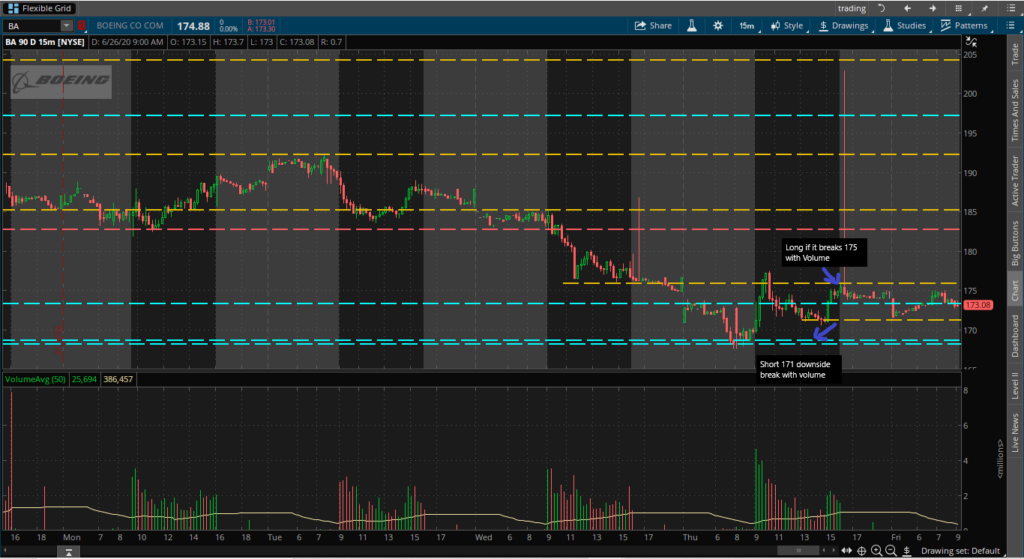
BA is overall bearish with short plays below 171 and 169 into lower lows. It is consolidating near the lows right now.